Crop appearance changes by growth stage, variety, weather, and field
Agriculture / Solution blueprint
Edge vision for crop health and resource efficiency
A field-ready vision pipeline for detecting plant stress, disease indicators, irrigation issues, and growth variation.
Explore the page ↓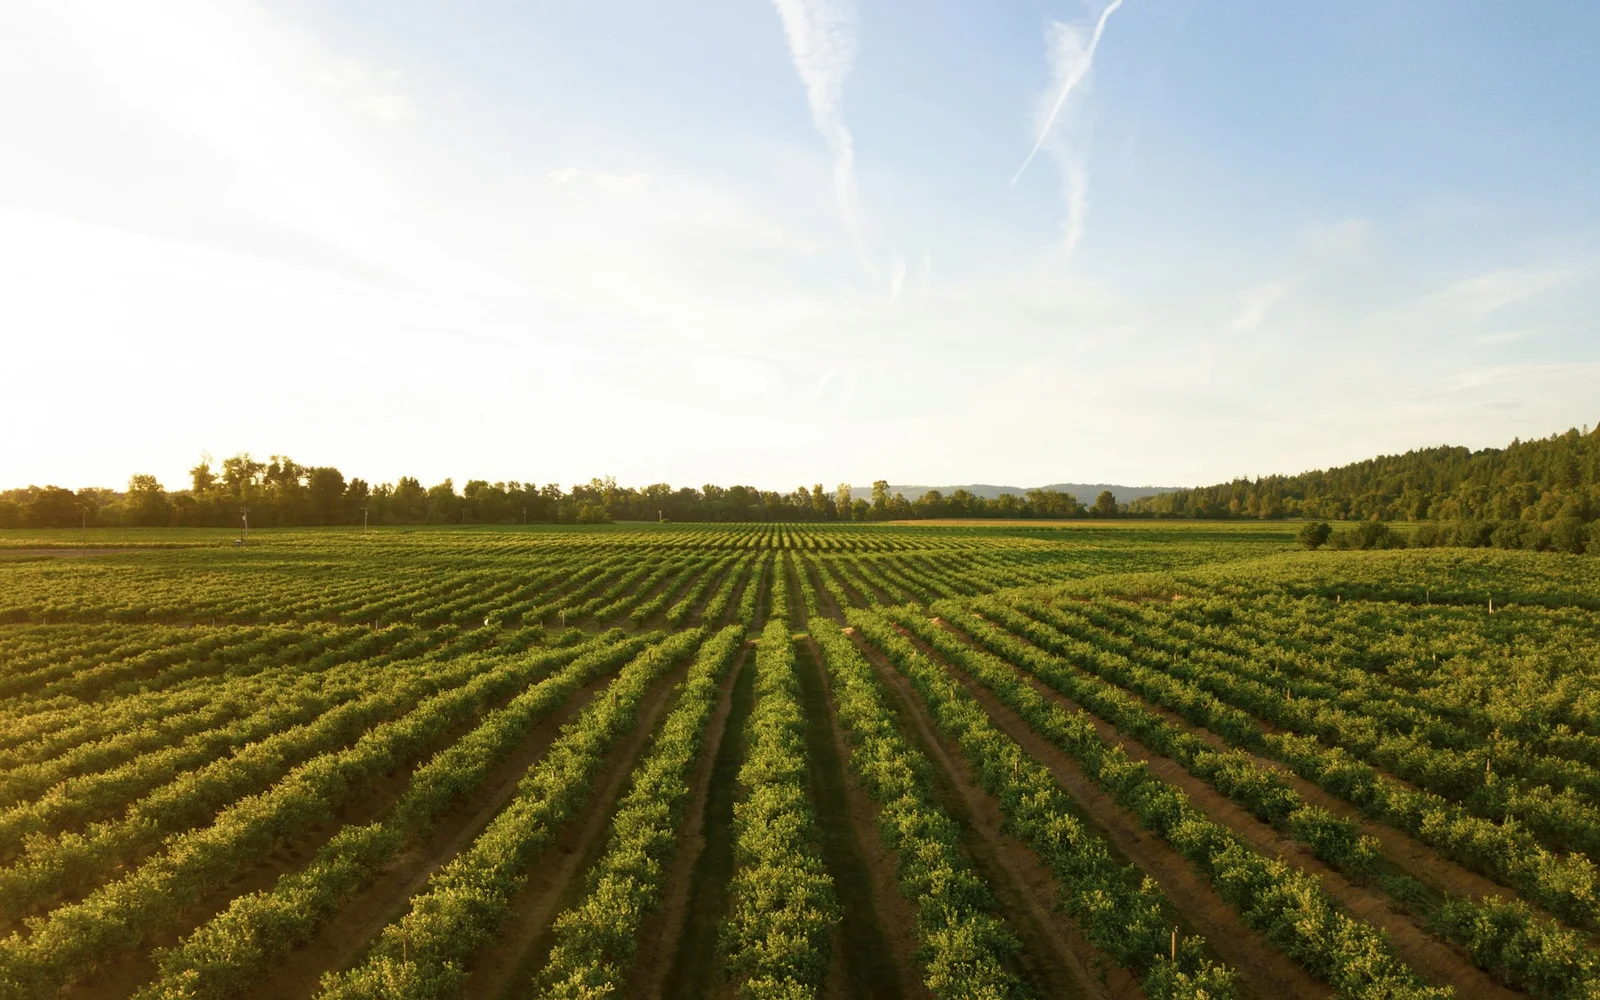
StatusSolution blueprint
IndustryAgriculture
SystemData → Intelligence → Action
01 / Problem statementProposed system · Agriculture
The operating problem
Large farms are difficult to inspect consistently, while delayed identification of stress or disease can increase input use and crop loss.
Conditions the system must survive03 operating constraints
Connectivity and battery capacity limit field processing
False alerts waste scouting time and treatment inputs
02 / How we approached it
A validation path before production commitment.
The blueprint is organized around four evidence gates. Each stage closes a specific uncertainty before the system moves closer to production.
01Frame
Collect representative field imagery
Evidence produced
Field-zone and crop-stage sampling plan
02Evaluate
Train models for crop and regional conditions
Evidence produced
Seasonally representative labeled imagery benchmark
03Engineer
Run inference on drone or edge devices
Evidence produced
Drone or edge-device inference and energy profile
04Operationalize
Map findings into prioritized field actions
Evidence produced
GIS action layer with scouting confirmation workflow
03 / Deployment design
Designed for the environment it must operate in.
The deployment model is proposed from the current operating constraints. Discovery and evaluation would confirm the final infrastructure and integration choices.
Blueprint statusProposed · requires discovery and acceptance testing
01
TopologyDrone, vehicle, or fixed-camera capture with local preprocessing and selective cloud synchronization.
02
IntegrationGeoreferenced findings enter GIS, farm-management, or scouting applications as prioritized field zones.
03
OperationModels are monitored by crop stage and region; agronomist confirmations become controlled feedback for future seasons.
04 / Evaluation metrics
What must be measured before the system earns trust.
These metrics establish the baseline and acceptance gates for a future implementation. Numerical targets are set against customer data during discovery.
01Evaluation gate
Condition recall
How it is measured
Recall by stress, disease indicator, crop stage, and severity.
What it decides
Determines whether the system can support early targeted scouting.
02Evaluation gate
Spatial precision
How it is measured
Agreement between mapped finding and confirmed field location.
What it decides
Sets the minimum useful resolution for an action layer.
03Evaluation gate
False alerts per hectare
How it is measured
Unconfirmed findings normalized by surveyed area.
What it decides
Quantifies unnecessary scouting burden.
04Evaluation gate
Edge survey efficiency
How it is measured
Area processed per battery cycle, latency, and synchronized data volume.
What it decides
Validates hardware and field operating economics.
05 / Customer perspective
Value has to appear in the customer’s operating day.
What matters in practice
A map is valuable when it identifies a location, severity, confidence, and the field evidence needed before acting.
06 / Technology context
Tools follow the system—not the other way around.
Final architecture depends on data quality, operating conditions, integrations, risk, and evaluation criteria established during discovery.
07 / Continue exploring
Related operational systems.
Explore adjacent work from the same industry or a related intelligence pattern.
View the full library ↗ Solution blueprintPhoto · Jakub Pabis
Oil & Gas
Edge AI for predictive maintenance and leak detection
A production blueprint for detecting equipment anomalies and potential leaks close to the asset—even where connectivity is limited.
Explore the architecture ↗ Solution blueprintPhoto · Remy Gieling
Manufacturing
Computer vision for visual quality inspection
A line-speed inspection architecture for surface defects, assembly errors, dimensional anomalies, and traceable quality decisions.
Explore the architecture ↗Test the operating assumption
Discuss this use case ↗